Hypothesis Evaluation
Before making claims about the accuracy of a particular trained model or any hypothesis, it is crucial to conduct statistical significance tests. This ensures that the claimed accuracy is reliable and not just a result of chance. It is essential not only in the context of machine learning or deep learning models but also in various other experiments.
Hypothesis evaluation plays a significant role in comparing means of two distributions, testing the stationarity of time series data, assessing data distribution, and many other generic experiments. By conducting hypothesis tests, we can determine the validity and reliability of our findings, ensuring that they are not merely coincidental.
Therefore, before making any assertions or conclusions, it is important to perform hypothesis evaluation and statistical significance tests to establish the credibility of the results.
Statistical Jargons
Let’s review some popular statistical terminologies before we begin evaluating hypotheses.
Data : Data can be defined as information, facts which has been collected for reference or analysis. Data can be either structured (numerical or categorical) or unstructured ( images, text, videos etc). Numerical data can be continuous or discrete and categorical data can be binary, ordinal(categorical data with explicit ordering) etc.
Sample: It is a subset from a large dataset or population.
Measures of Central Tendency/Location : This includes statistics like mean, median, mode, weighted mean, weighted median, trimmed mean etc .
Measures of Dispersion/Variability : This include statistics like range, interquartile range , variance, standard deviation (L2 norm or Euclidean norm), mean absolute deviation (L1 norm or Manhattan norm) etc.
Sampling : Sampling can be of various types like random sampling, bootstraping (sampling with replacement), resampling (sampling with or without replacement), stratified sampling (dividing the dataset into strata and then sampling from each strata) , etc.
Bias : Bias can be simply defined as systematic error. There are various kinds of bias like sample bias (bias due to non-random sampling), selection bias(occurs when cherry picking data, non-random sampling, stopping experiment when results looks interesting), etc.
Standard Error : It is the standard deviation of the sampling distribution.
Confidence Interval : One common way to describe the uncertainty associated with an estimate is to give an interval within which the true value is expected to fall, along with the probability with which it is expected to fall into this interval. Such estimates are called confidence interval estimates.
Central Limit Theorem : It states that the distribution of sample means approximates a gaussian distribution as the sample size gets larger, irrespective of the underlying population’s distribution.
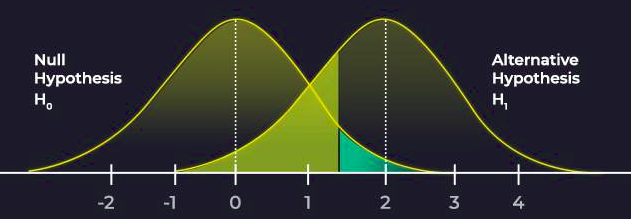
Null Hypothesis : To test where one method is better than the other, we assume there is no difference between the methods. And thus null hypothesis is a hypothesis that is formulated for the sake of rejecting it under the assumption that is true.
Alternate Hypothesis : Opposite of null hypothesis.
P-value : Probability for the null hypothesis to be true. Normally when p<0.05 (i.e., there is 0.05% chance that null hypothesis is true), we reject null hypothesis and accept alternate hypothesis.
Type I error : If a hypothesis is rejected while it should have been accepted.
Type II error : If a hypothesis is accepted while it should have been rejected.
Parametric Tests
There are various statistical test out there and one have to choose wisely which test to apply for particular problem. On a very broad level if we have prior knowledge about the under lying data distribution (mainly normal distribution with a fixed set of parameters) then parametric tests like T-Test, Z-Test, ANOVA test etc are used. And if we don’t have prior knowledge about the under lying data distribution then non-parametric test like Mann-Whitney U Test is used.
T-Test
It is used for hypothesis testing mainly when sample size is very less (less than 30) and sample standard deviation is not available. However under lying distribution is assumed to be normal. A T-Test is of two types. One-Sample T-Test , which is used for comparing sample mean with that of a population mean. Two-Sample T-Test, which is used for comparing means of two samples. When observation across each sample are paired the it is called Pared T-Test.
| |
Z-Test
It is used for hypothesis testing mainly when sample size is high (greater than 30) . And under lying distribution is assumed to be normal. A Z-Test is of two types. One-Sample Z-Test , which is used for comparing sample mean with that of a population mean. Two-Sample Z-Test, which is used for comparing means of two samples.
| |
ANOVA Test
ANOVA Test stands for Analysis of Variance. It is a generalisation or extension for Z-Test. This test tells us whether two or more samples are significantly same or different. Similar to Paired T-Test, there is also Repeated Measures ANOVA Test which tests whether the means of two or more paired samples are significantly different or not.
| |
Non-Parametric tests
Non-Parametric tests are the ones where we don’t make any assumptions about the underlying distribution. And most of the non-parametric tests are carried out with bootstraped samples. Some of the non-parametric test are as follows:
- Mann-Whitney U Test
- Wilcoxon Signed-Rank Test
- Kruskal-Wallis H Test
- Friedman Test
| |
Stationarity tests
A time series data is said to stationary if its mean and variance doesn’t vary with time. Some of the widely used stationarity tests are as follows :
- Augmented Dickey-Fuller Unit Root Test
- Kwiatkowski-Phillips-Schmidt-Shin Test
Correlation Tests
To test whether two samples are related or not, following tests can be used :
- Pearson’s Correlation Coefficient
- Spearman’s Rank Correlation
- Kendall’s Rank Correlation
- Chi-Squared Test
| |
Normality Tests
To test whether a given data distribution is normal/gaussian or not, following tests are mostly used :
- Shapiro-Wilk Test
- D’Agostino’s K² Test
- Anderson-Darling Test
All the above test can be simply implemented in python with the help of scipy library and there is awesome blog by Jason Brownlee (in reference) where all the above tests have been carried out in python.
References
- Machine Learning by Tom Mitchell
- Engineering Mathematics by B. S. Grewal
- https://machinelearningmastery.com/statistical-hypothesis-tests-in-python-cheat-sheet/
- https://machinelearningmastery.com/statistical-hypothesis-tests/